

Đề bài
Đọc kỹ, gạch chân từ khoá trước khi viếtThe bar chart illustrates the number of international tourist arrivals (in millions) to a Southeast Asian country over a five-year period from 2018 to 2022. The data is broken down by region of origin: Europe, Asia, North America, and Oceania. Summarise the information by selecting and reporting the main features, and make comparisons where relevant.
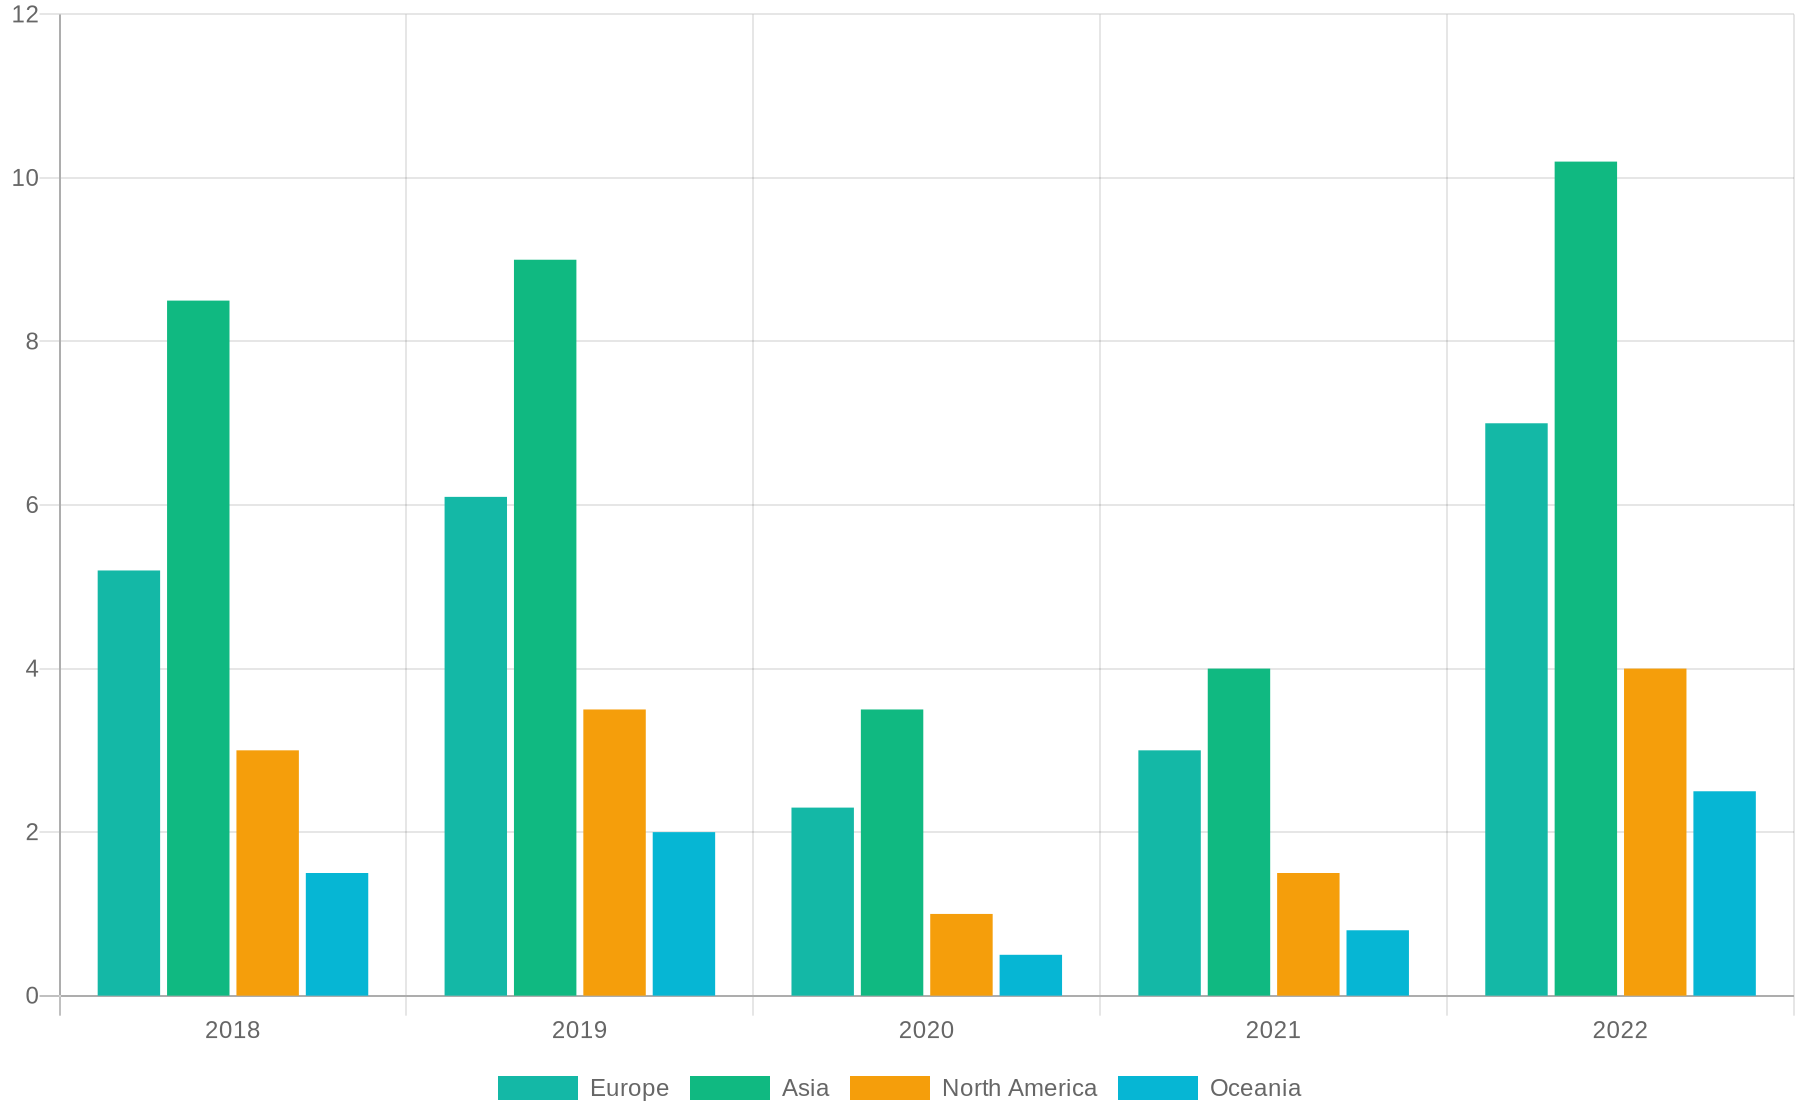
Đăng nhập để xem biểu đồ
Đăng nhập