
Đề bài
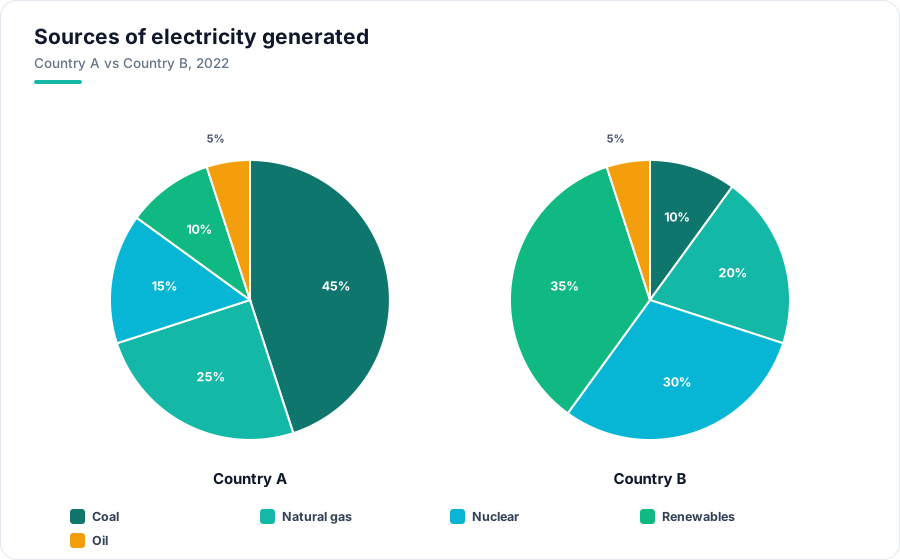
Đọc kỹ, gạch chân từ khoá trước khi viếtThe pie charts below show the sources of electricity generated in Country A and Country B in 2022. Summarise the information by selecting and reporting the main features, and make comparisons where relevant.
**Country A:**
- Coal: 45%
- Natural Gas: 25%
- Nuclear: 15%
- Renewable (Solar/Wind/Hydro): 10%
- Oil: 5%
**Country B:**
- Coal: 10%
- Natural Gas: 20%
- Nuclear: 30%
- Renewable (Solar/Wind/Hydro): 35%
- Oil: 5%
Đăng nhập để xem biểu đồ
Đăng nhập