

Đề bài
Đọc kỹ, gạch chân từ khoá trước khi viếtThe line graph below shows the average monthly temperatures in three different cities (London, Dubai and Sydney) over a one-year period.
Summarise the information by selecting and reporting the main features, and make comparisons where relevant.
Write at least 150 words.
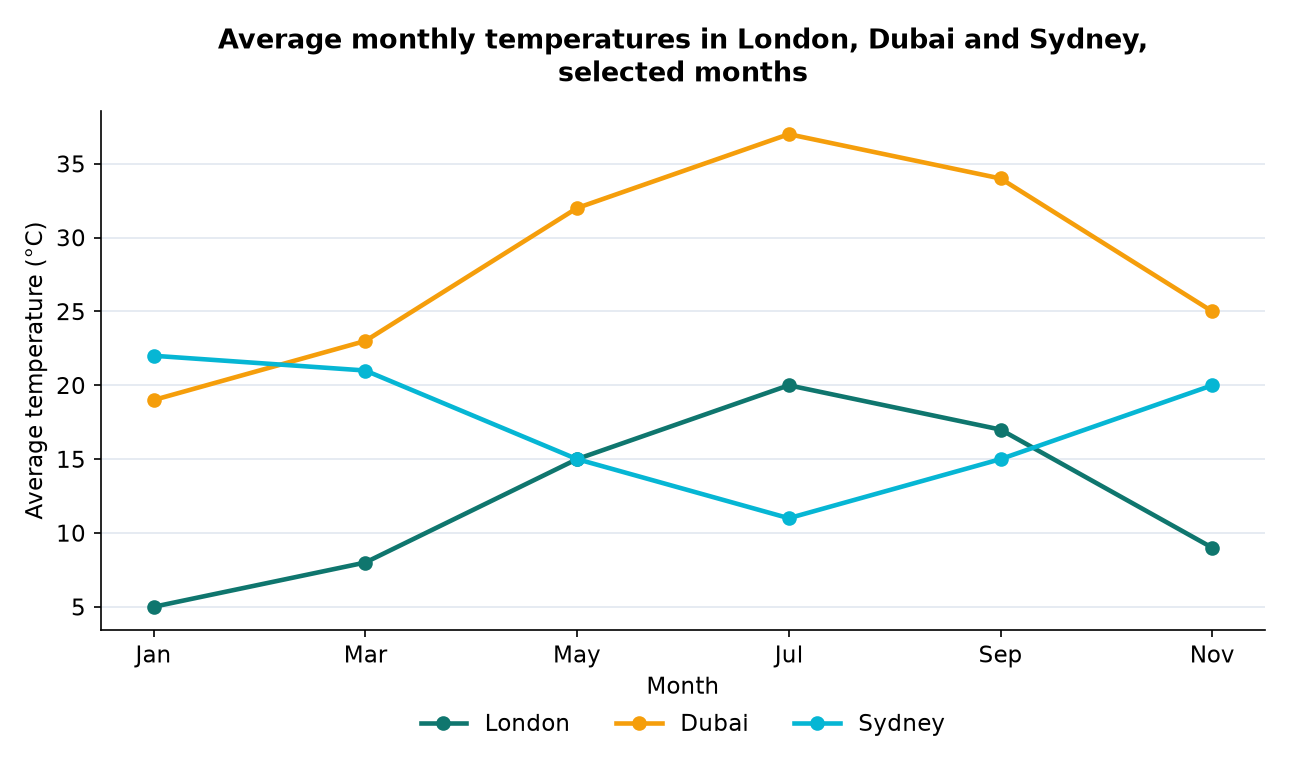
Đăng nhập để xem biểu đồ
Đăng nhập