


Đề bài
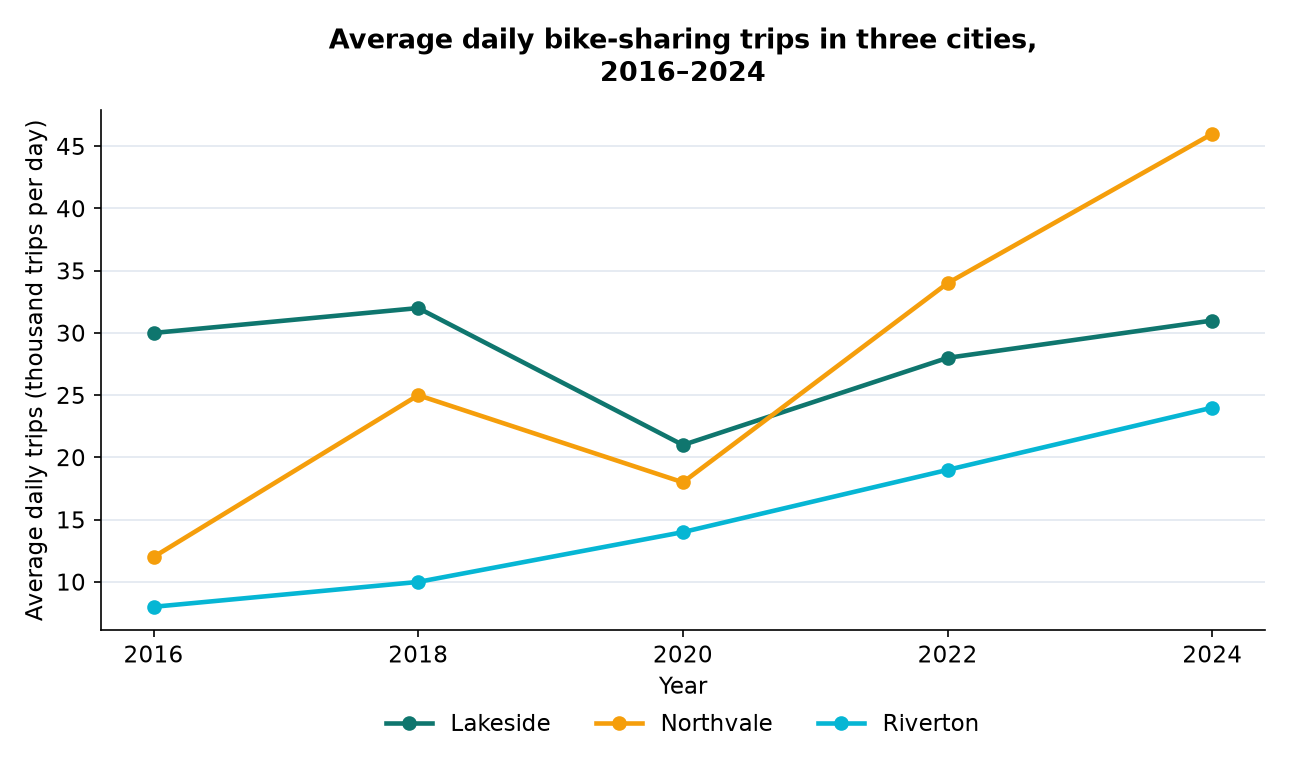
Đọc kỹ, gạch chân từ khoá trước khi viếtThe line graph below shows the average number of daily bike-sharing trips (in thousands) in three cities from 2016 to 2024.
Summarise the information by selecting and reporting the main features, and make comparisons where relevant.
Write at least 150 words.
Đăng nhập để xem biểu đồ
Đăng nhập